Radeon RX 7900 GRE vs GeForce RTX 5060 Ti 16GB

Quick Verdict
The Radeon RX 7900 GRE is 28% faster on average, but costs $410 more. GeForce RTX 5060 Ti 16GB offers better value if you're on a budget.
Specifications Comparison
| Spec | Radeon RX 7900 GRE | GeForce RTX 5060 Ti 16GB |
|---|---|---|
| Brand | AMD | NVIDIA |
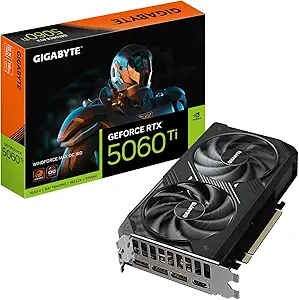
| VRAM | 16GB GDDR6 | 16GB GDDR7 |
| TDP | 260W | 200W |
| PCIe | 4.0 | 4.0 |
| Price | $860 | $450 |
| Power Connectors | 8pin, 8pin | 8pin |
Gaming Performance Comparison (1440p Ultra)
Radeon RX 7900 GRE Benchmarks
| Game | 1080p High | 1080p Ultra | 1440p Ultra | 4K Ultra |
|---|---|---|---|---|
| Grand Theft Auto VI | 88 FPS | 68 FPS | 22 FPS | 14 FPS |
| Rocket League | 569 FPS | 508 FPS | 356 FPS | 244 FPS |
| Cyberpunk 2077 | 107 FPS | 96 FPS | 64 FPS | 28 FPS |
| Red Dead Redemption 2 | 102 FPS | 91 FPS | 64 FPS | 42 FPS |
| Hogwarts Legacy | 106 FPS | 95 FPS | 63 FPS | 27 FPS |
| Star Wars Outlaws | 104 FPS | 93 FPS | 62 FPS | 27 FPS |
| Call of Duty: Warzone | 140 FPS | 125 FPS | 93 FPS | 58 FPS |
| Counter-Strike 2 | 332 FPS | 307 FPS | 230 FPS | 148 FPS |
| Valorant | 399 FPS | 380 FPS | 285 FPS | 182 FPS |
| Fortnite | 348 FPS | 311 FPS | 224 FPS | 136 FPS |
GeForce RTX 5060 Ti 16GB Benchmarks
| Game | 1080p High | 1080p Ultra | 1440p Ultra | 4K Ultra |
|---|---|---|---|---|
| Grand Theft Auto VI | 59 FPS | 45 FPS | 15 FPS | 12 FPS |
| Rocket League | 464 FPS | 414 FPS | 290 FPS | 199 FPS |
| Cyberpunk 2077 | 72 FPS | 64 FPS | 42 FPS | 18 FPS |
| Red Dead Redemption 2 | 70 FPS | 62 FPS | 44 FPS | 28 FPS |
| Hogwarts Legacy | 74 FPS | 66 FPS | 44 FPS | 19 FPS |
| Star Wars Outlaws | 71 FPS | 64 FPS | 42 FPS | 18 FPS |
| Call of Duty: Warzone | 98 FPS | 88 FPS | 66 FPS | 41 FPS |
| Counter-Strike 2 | 256 FPS | 237 FPS | 178 FPS | 114 FPS |
| Valorant | 319 FPS | 304 FPS | 228 FPS | 145 FPS |
| Fortnite | 273 FPS | 244 FPS | 176 FPS | 107 FPS |
Detailed Analysis
Performance by Resolution
1080p Gaming
At 1080p resolution, the Radeon RX 7900 GRE leads by approximately 28.4%. Both cards easily handle 1080p gaming at high framerates, but Radeon RX 7900 GRE pulls ahead.
1440p Gaming
1440p is where the difference becomes more noticeable. The Radeon RX 7900 GRE averages 28.2% higher FPS, which can mean the difference between hitting 144Hz or not in demanding titles.
4K Gaming
At 4K Ultra, the Radeon RX 7900 GRE shows a 27.4% advantage. For serious 4K gaming, this performance gap can significantly impact your experience.
Value Analysis
In terms of value, the GeForce RTX 5060 Ti 16GB at $450 offers better FPS per dollar. If you're looking to maximize your budget, this is the smarter choice.
Who Should Buy Which?
- Buy Radeon RX 7900 GRE if: You prioritize raw performance and don't mind paying extra for it.
- Buy GeForce RTX 5060 Ti 16GB if: You want the best bang for your buck and don't need the absolute fastest card.